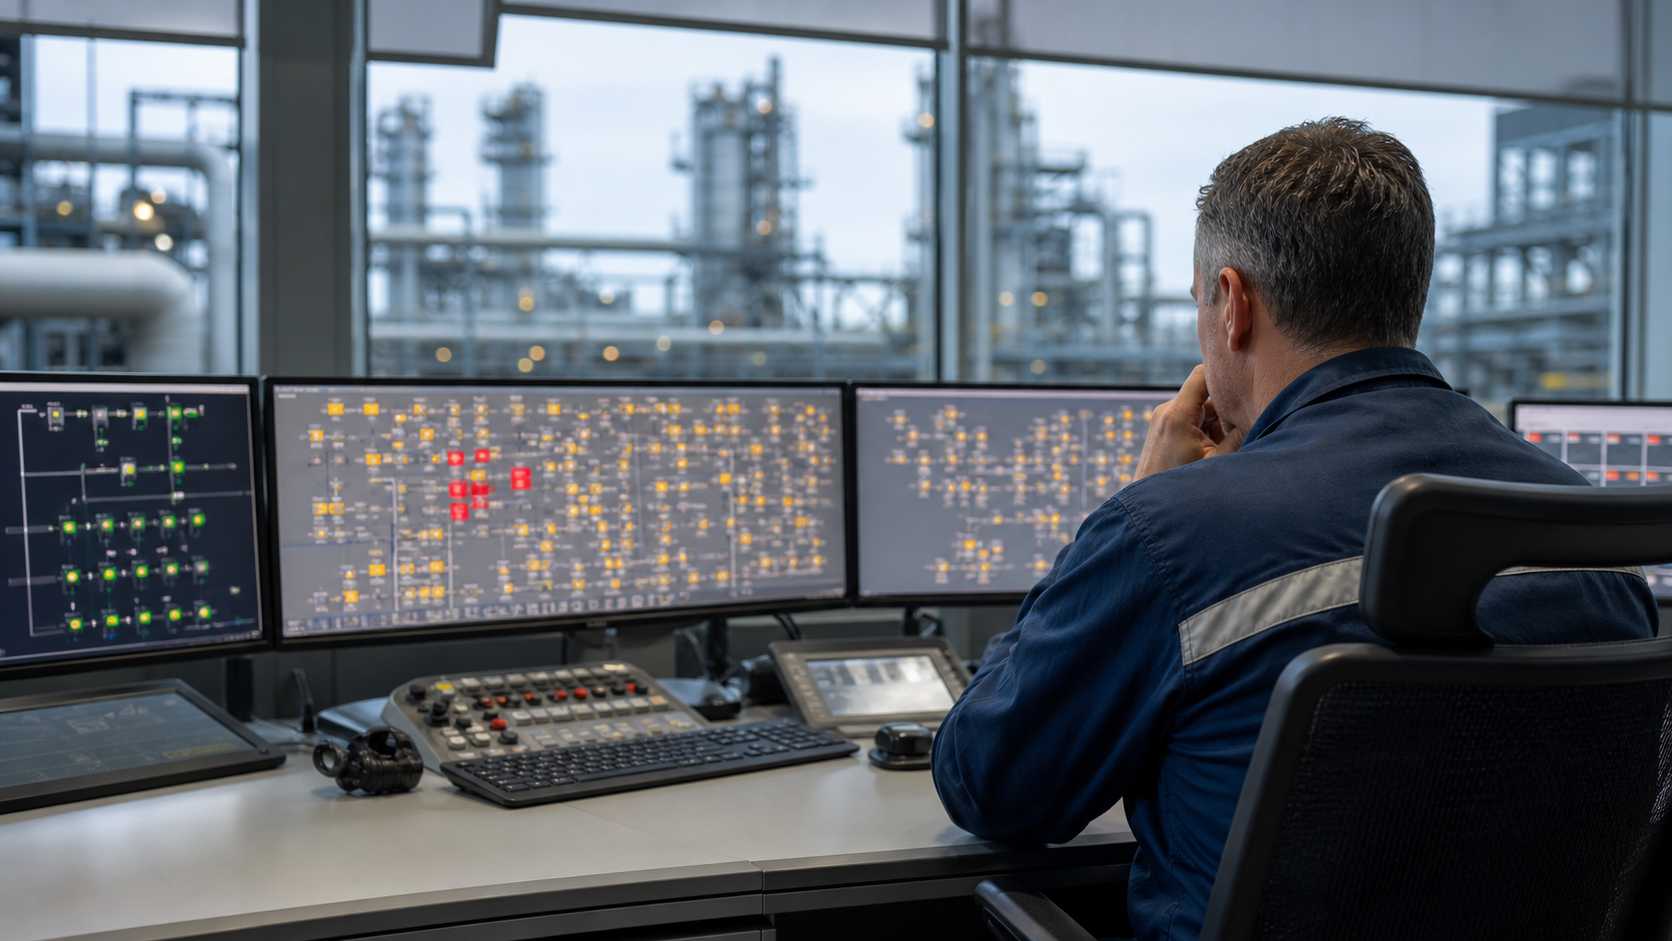
An alarm banner can become busy without becoming useful. During a disturbance, the display asks for attention repeatedly but may not explain which signal needs action. Industrial alarm fatigue starts when attention is consumed before the process has been understood.
Measure first, then discuss individual alarms.
Counting every annunciation in a day will not show that problem by itself. A total mixes consoles, shifts, operating modes, shutdowns, startup work, maintenance and genuine upsets. The question is narrower: at a console, in a particular operating mode, did the alarm system give the operator a timely, actionable signal? The Health and Safety Executive’s alarm-management guidance frames alarms around plant conditions that need timely assessment or action. The ISA-18 series treats that work as a lifecycle, from definition and design through monitoring and modification.
This article explains how to measure alarm load, find patterns that deserve review, and prepare a rationalization discussion without treating a dashboard cleanup as a safety decision. See the alarm management evidence before changes enter the approved rationalization and management-of-change process.
When an alarm stops helping
In ISA terminology, an alarm is an audible or visible indication of a malfunction, deviation, or abnormal condition that needs a timely operator response. The purpose is to alert an operator to an abnormal process condition or equipment malfunction and require a timely response. ISA’s safety-alarm article This distinction matters because a control room can contain many useful messages that should not compete with alarms for the same attention.
An event records that something happened. A diagnostic may help maintenance. A notification may tell another role about a routine state. An alarm should mean that someone with responsibility for the process needs to assess a condition and decide what to do in time. The ISA-18 series page describes a companion report on non-alarm notifications precisely because prompts, notices and alerts for people beyond the control-room operator should not add needless distraction to the alarm system.
Alarm fatigue develops when repeated, low-value or poorly timed alarms consume attention and make it harder to notice an alarm that needs a timely response. That does not mean an operator suddenly stops caring. People adapt to the screen they are given. They learn which messages clear on their own, which tags are normally active, and which equipment messages arrive after a process condition has already been noticed elsewhere. The HSE guidance warns that alarm systems need to reflect human capabilities and limitations. Its discussion of the Milford Haven refinery incident also shows why a prolonged barrage cannot be reduced to a problem of individual attention.
The question for a review is therefore not “which alarm annoys people?” It is “what abnormal condition does this alarm represent, who is expected to act, and how much time is available?” EEMUA Publication 191 covers alarm-system work. That distinction guides every later review.
Why the daily average can hide the problem
Daily alarm totals are attractive because they are easy to export. They are also easy to misread. A console that receives 120 alarms over a quiet twenty-four hours does not have the same operating burden as a console that receives the same number in two ten-minute clusters during a startup. The operator’s work changes with the time pattern, the running state, the number of plant areas in view, and whether the messages are independent or consequences of one initiating condition.
The ISA article on safety-alarm performance presents example metrics based on at least 30 days of data. Its table expresses average annunciated alarms per hour per operator console, rather than a plant-wide total, with roughly six as “very likely to be acceptable” and roughly twelve as “maximum manageable.” The same article presents a flood metric as the percentage of time in flood condition and gives an example target below one percent. These are published examples for assessing alarm-system performance, not universal pass/fail limits for every unit, crew or operating state.
The article describes a flood metric as the percentage of time during which an operator receives more than ten alarms in ten minutes ISA. That definition is useful because it makes the denominator visible. ISA’s current standards overview similarly identifies alarm rates, standing alarms and response times as performance indicators for ongoing assessment. The Center for Operator Performance’s Alarm Rates II project exists to examine alarm-rate guidance and its relation to operator performance, which is further evidence that raw counts need context.
For a baseline, separate normal operation, transitions, maintenance or testing windows, and known disturbances ISA. Then calculate average rate per console, the highest rate in ten-minute windows, time in flood, and the contribution of the most frequent alarms.
A benchmark becomes useful when it triggers a question: which console, which period, which mode, and which alarms created the load? Without those labels, a daily average can look reassuring while the operator still experiences a flood.
How noise changes operator trust
Repeated alarms alter the working relationship between a person and the alarm system. If a tag frequently arrives without a new condition or a practical response, it becomes less credible. If an alarm stays active through a known state, its presence becomes normal. If several consequence alarms arrive before the initiating condition can be understood, the banner can become a search problem rather than a decision aid. Those patterns do not prove that an operator will ignore every alarm. They do create conditions in which attention, verification and response become harder.
The ISA safety-alarm article explicitly notes that as false alarms increase toward 50 percent, operator confidence in a safety alarm falls and response can decline. It also says that an extended time in alarm can make the alarm state feel normal, describing this as normalization of deviance. Those statements address safety-alarm performance in the article’s stated context; they should not be converted into a single percentage for every alarm system. They do, however, explain why a standing alarm is more than an untidy display element.
James Reason’s work on human error offers a useful way to discuss this without blaming the person at the console. Serious failures should be examined through the system conditions and defenses around the final human action, rather than through that action alone. A review that asks only why an operator acknowledged an alarm misses the design decisions, operating conditions, procedures and equipment states that shaped what was visible and plausible at that moment.
That approach changes the questions asked after a flood. Was the initiating condition alarmed early enough? Were consequence alarms distinguishable from cause candidates? Did an old standing alarm occupy attention? Was there a response procedure the operator could use under time pressure? The HSE’s guidance treats alarm management as a human-factors issue, not merely an engineering configuration exercise.
Trust is built or eroded through experience. For event reconstruction, see industrial incident investigation.
Build a 30-day baseline before changing anything
A 30-day baseline is not a complete rationalization study. It is a disciplined starting point. The ISA article uses at least 30 days of data for its example performance metrics, while ISA-TR18.2.5 is described by ISA as covering monitoring, assessment and auditing through measures including alarm rates, standing alarms and response times. Use the period to make the alarm system observable before deciding what to change.
Start by naming the console or position, the process area, the data source and the exact time range. Do not merge all consoles unless the team can explain why their workloads are interchangeable. Mark operating modes in the event history: steady running, grade change, cleaning, startup, shutdown, testing, maintenance and upset recovery. This creates a baseline that can be read later rather than a pile of exports with unknown context.
Next, calculate average annunciated alarms per hour for each console and identify the peak ten-minute windows. Measure the percentage of time in flood using the selected definition. Rank alarms by count, but retain their timestamps and modes so the list does not hide a burst caused by one intervention. Count active alarms that remain standing for long periods. Identify chattering alarms, which repeatedly change state, fleeting alarms, which clear before useful action is possible, and stale alarms, which remain active after their information value has expired. These labels are review cues, not automatic deletion categories.
Then inspect the pattern behind each candidate. A frequent alarm during cleaning may be appropriate in one mode and inappropriate in another. A standing alarm may be a current process condition, a failed instrument, a configuration issue, or an unclosed work item. A group of alarms may be a cascade after one initiating event. See maintenance troubleshooting evidence for instrument faults. The EEMUA 191 contents document lists monitoring, assessment and audit alongside design and operation, which fits this sequence: measure, investigate, then decide.
Rationalize alarms through decisions, not cleanup
Rationalization asks whether each candidate alarm belongs in the operator’s workload and, if it does, how it should work. ISA’s standards overview describes ISA-TR18.2.2 as guidance for identification and rationalization, including deciding whether an alarm is needed, documenting details, assigning priorities and classifying alarms according to an alarm philosophy. The lifecycle description also connects rationalization with implementation, maintenance and ongoing change management.
For each alarm, put the questions on one review record. What abnormal condition does it represent? Does a control-room operator need to act? What happens if nobody acts? How much time is available? In which modes is the alarm valid? Is the priority based on consequence and response time? Does another alarm already represent the same condition? Is this tag a consequence of a different initiating alarm? Could an instrument fault or a missing procedure explain the alarm’s behavior?
Keep an alarm when it represents an abnormal condition with a defined timely response. Repair an instrument when the event record points to bad measurement rather than a process alarm. Rework presentation or mode logic only after the appropriate review. Revisit priority when consequence and response time do not support the current assignment. Combine or redesign duplicates when the rationale shows they are competing for the same operator action. Retire an alarm only through the decision process that documents why it no longer meets the approved philosophy.
The EEMUA Publication 191 page describes its scope as design, management and procurement for alarm systems, and the ISA-18 series names documented philosophy, prioritization, monitoring and change management as lifecycle elements. A ranked list can choose where to look first. It cannot replace the rationale for changing a set point, priority, alarm state, logic or response procedure.
A review can support retaining an alarm when the record shows that it gives the right person enough time and information to act on an abnormal condition (per ISA) ISA. Where the record cannot show that, the candidate belongs in the approved review process. Use management-of-change evidence for authorized changes.
A four-week route from data to a structured review
In week one, agree the console, alarm source, period and operating-mode labels. Check clock alignment, missing event records and duplicate sources before producing metrics. This prevents a team from treating different timestamps as a process sequence.
In week two, publish the baseline and select alarm families for review. Include a burst, standing alarm and frequent recurring alarm only when the data supports those categories. Compare each candidate with the operating-mode record and any nearby work order or procedure change. The Center for Operator Performance’s alarm-rate research concerns operator performance, not a plant-wide metric. The HSE guidance keeps the focus on timely operator assessment or action.
In week three, hold a rationalization workshop with operations, control engineering, instrumentation, maintenance and process-safety representation appropriate to the plant. Bring event windows, trends, procedures, the existing philosophy and the baseline record. Ask the same questions for each candidate. Record uncertainty instead of forcing a quick answer. If a candidate affects a safety function or a credited safeguard, use the relevant plant process rather than treating it as a routine cleanup item.
In week four, turn accepted findings into controlled actions: investigate an instrument, revise a procedure, schedule a design review, or start the formal change process. Assign owners and dates. Keep rejected candidates and their reasons. After approved changes are implemented, monitor the same console and modes again. A lower count alone does not prove a safer system or a better operator response. It may reflect a legitimate improvement, a seasonal operating change, a hidden condition, or a change that moved information elsewhere. Compare the new evidence with the baseline before declaring success.
Pick one console and one recent thirty-day window. Produce the baseline, identify the worst ten-minute period, and take one alarm family into a documented review. That is enough to replace a vague complaint about noise with a concrete question about operator action, plant condition and change authority.
Frequently asked questions
What is alarm fatigue in an industrial plant?
Alarm fatigue develops when repeated, low-value or poorly timed alarms consume attention and make it harder to notice an alarm that needs a timely response. It concerns working conditions and alarm-system design, not proof that a person does not care. Review it first by operating mode. HSE frames the purpose around timely assessment or action.
How many alarms per hour can an operator manage?
The answer depends on the console, operating mode and workload; ISA-published examples use rates per operator console and should be treated as context-sensitive reference points, not universal limits. One ISA article gives examples around six and twelve average alarms per hour per console and pairs them with time in flood condition. ISA provides the context.
How can a plant identify nuisance alarms?
Start with event history and operating context, then review frequent, standing, chattering or stale alarms against the action they require and the condition they represent. Preserve console, mode and timestamps; a raw count can hide a valid transition message, instrument problem or repeated consequence. ISA monitoring guidance lists rates and standing alarms among relevant measures.
What should be documented during alarm rationalization?
Document the abnormal condition, required response, consequence, available response time, priority, operating mode, set point basis and any management-of-change decision. Also note duplicate operator actions and evidence pointing to equipment or instrument work. ISA’s rationalization description links this work to need, documentation, priority and classification.
Why is suppressing noisy alarms not enough?
Suppression may hide a symptom without resolving the alarm design, instrument condition, operating mode or missing response procedure that created the noise. Any suppression decision should be supported by the approved philosophy and change process. EEMUA 191 places the issue within alarm-system design and management.